
Description
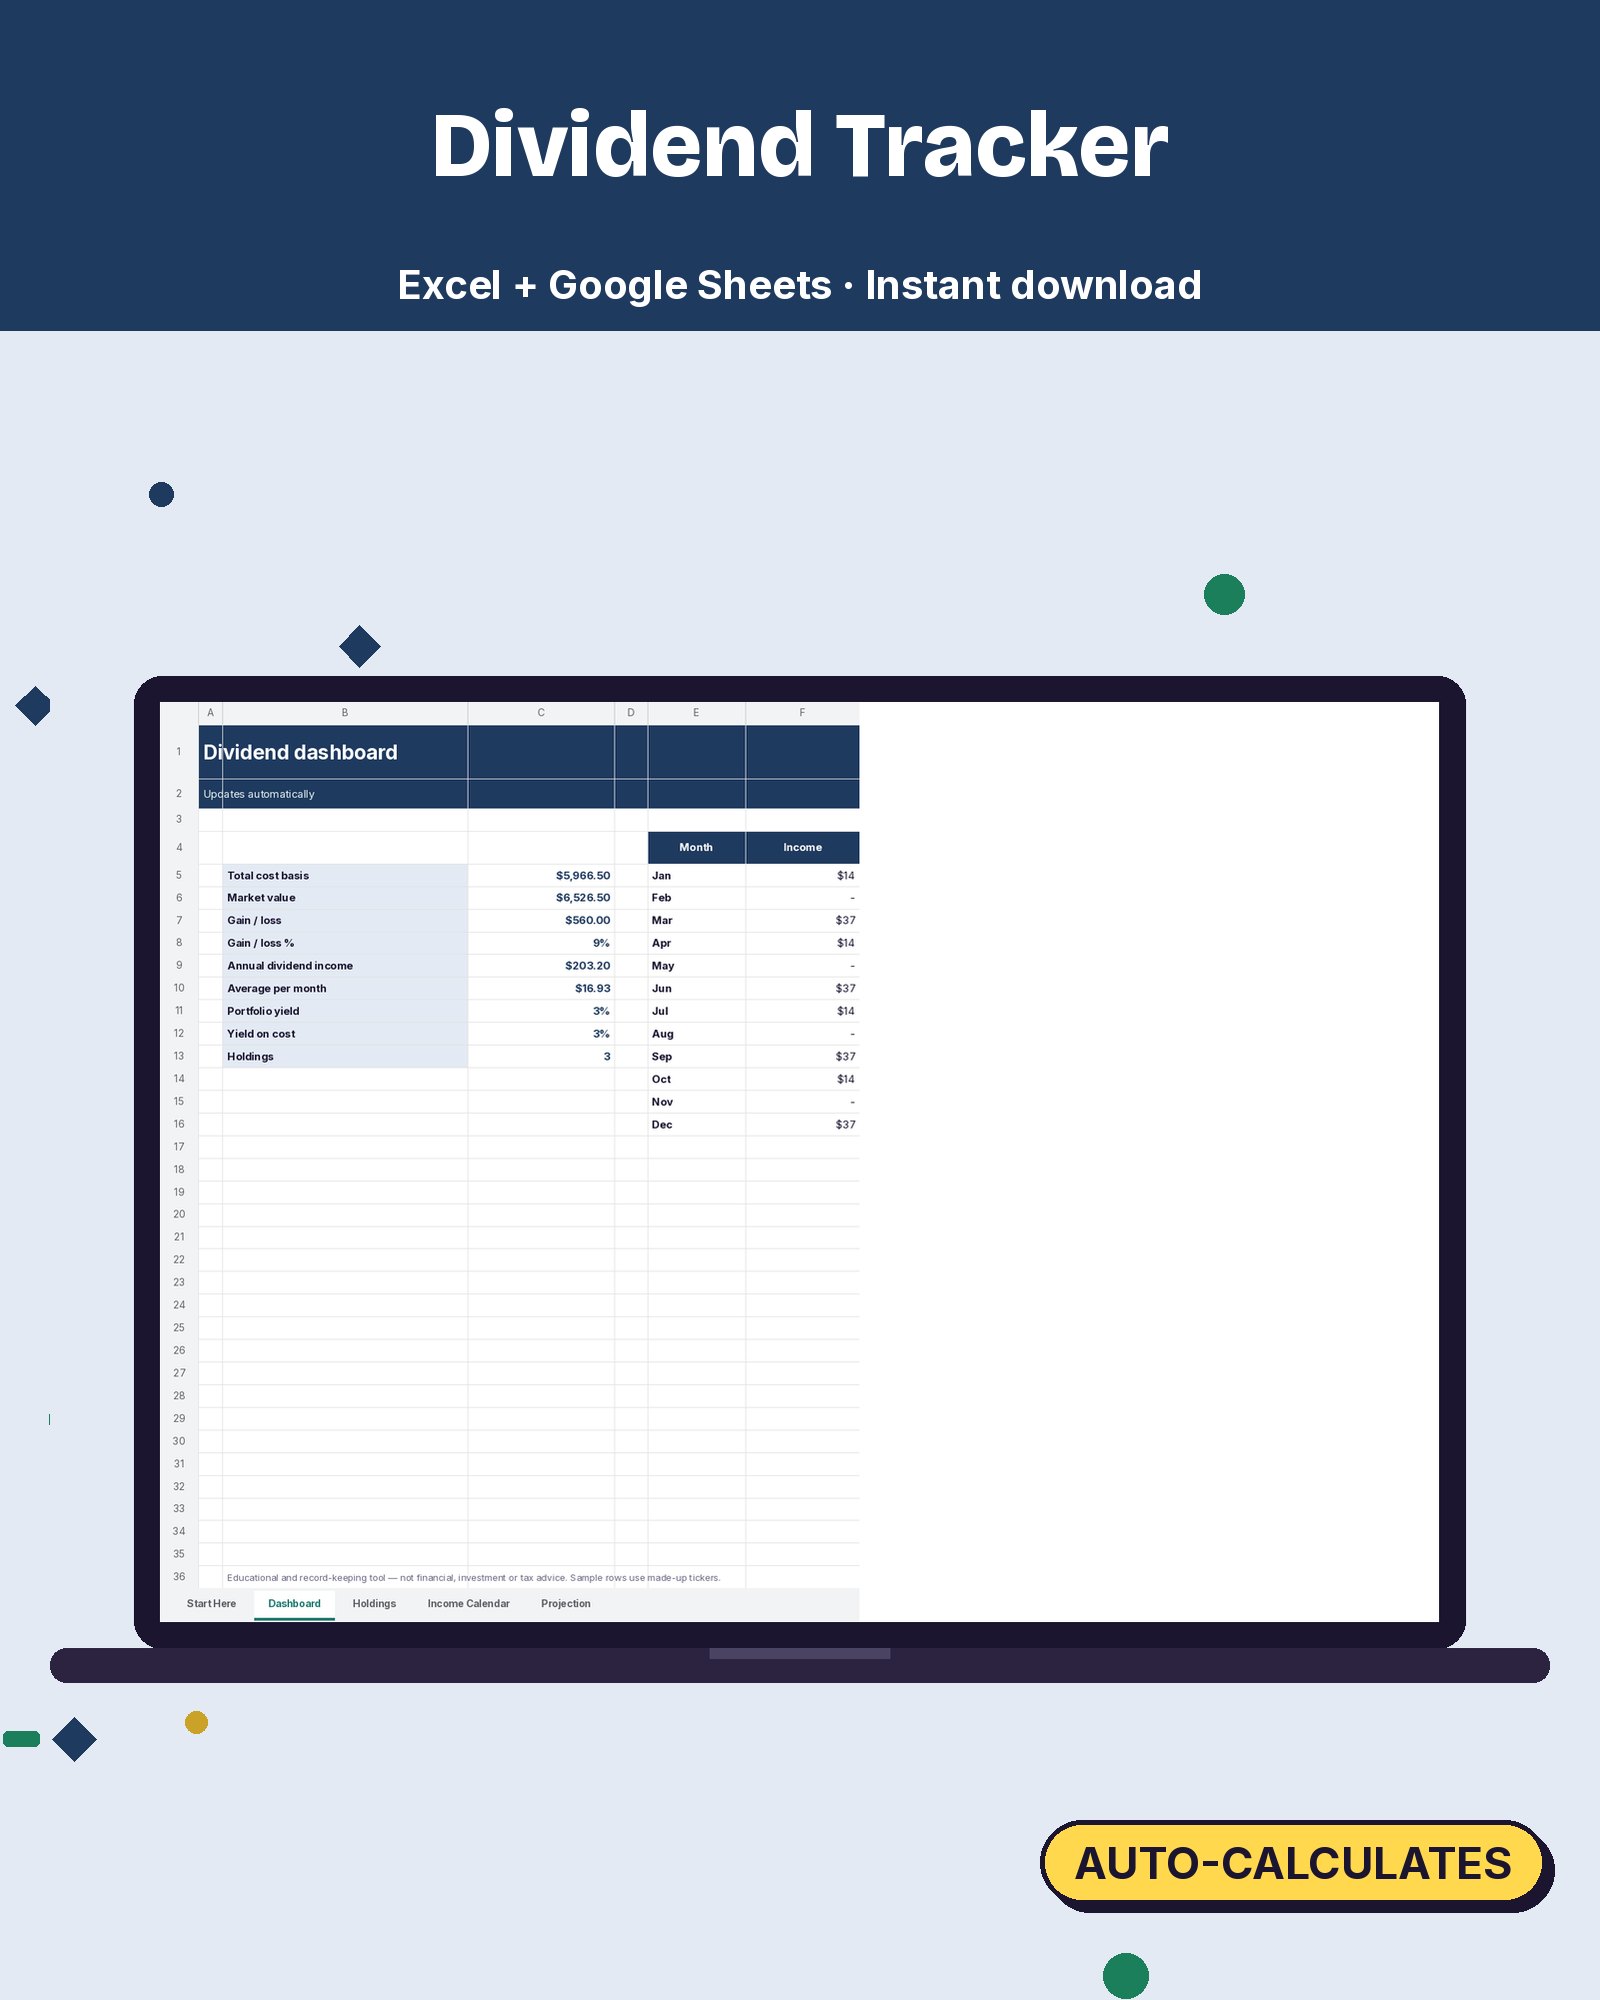
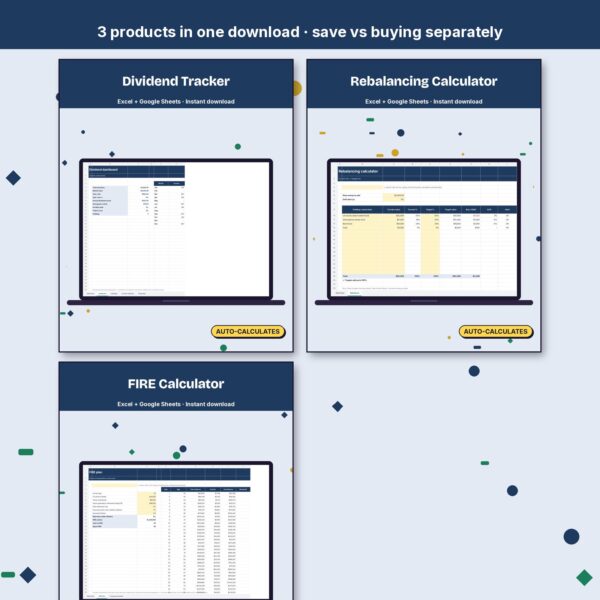
Watch your passive income grow. See how much each holding pays, which months the money arrives, and how reinvesting could add up over 20 years.
What’s inside
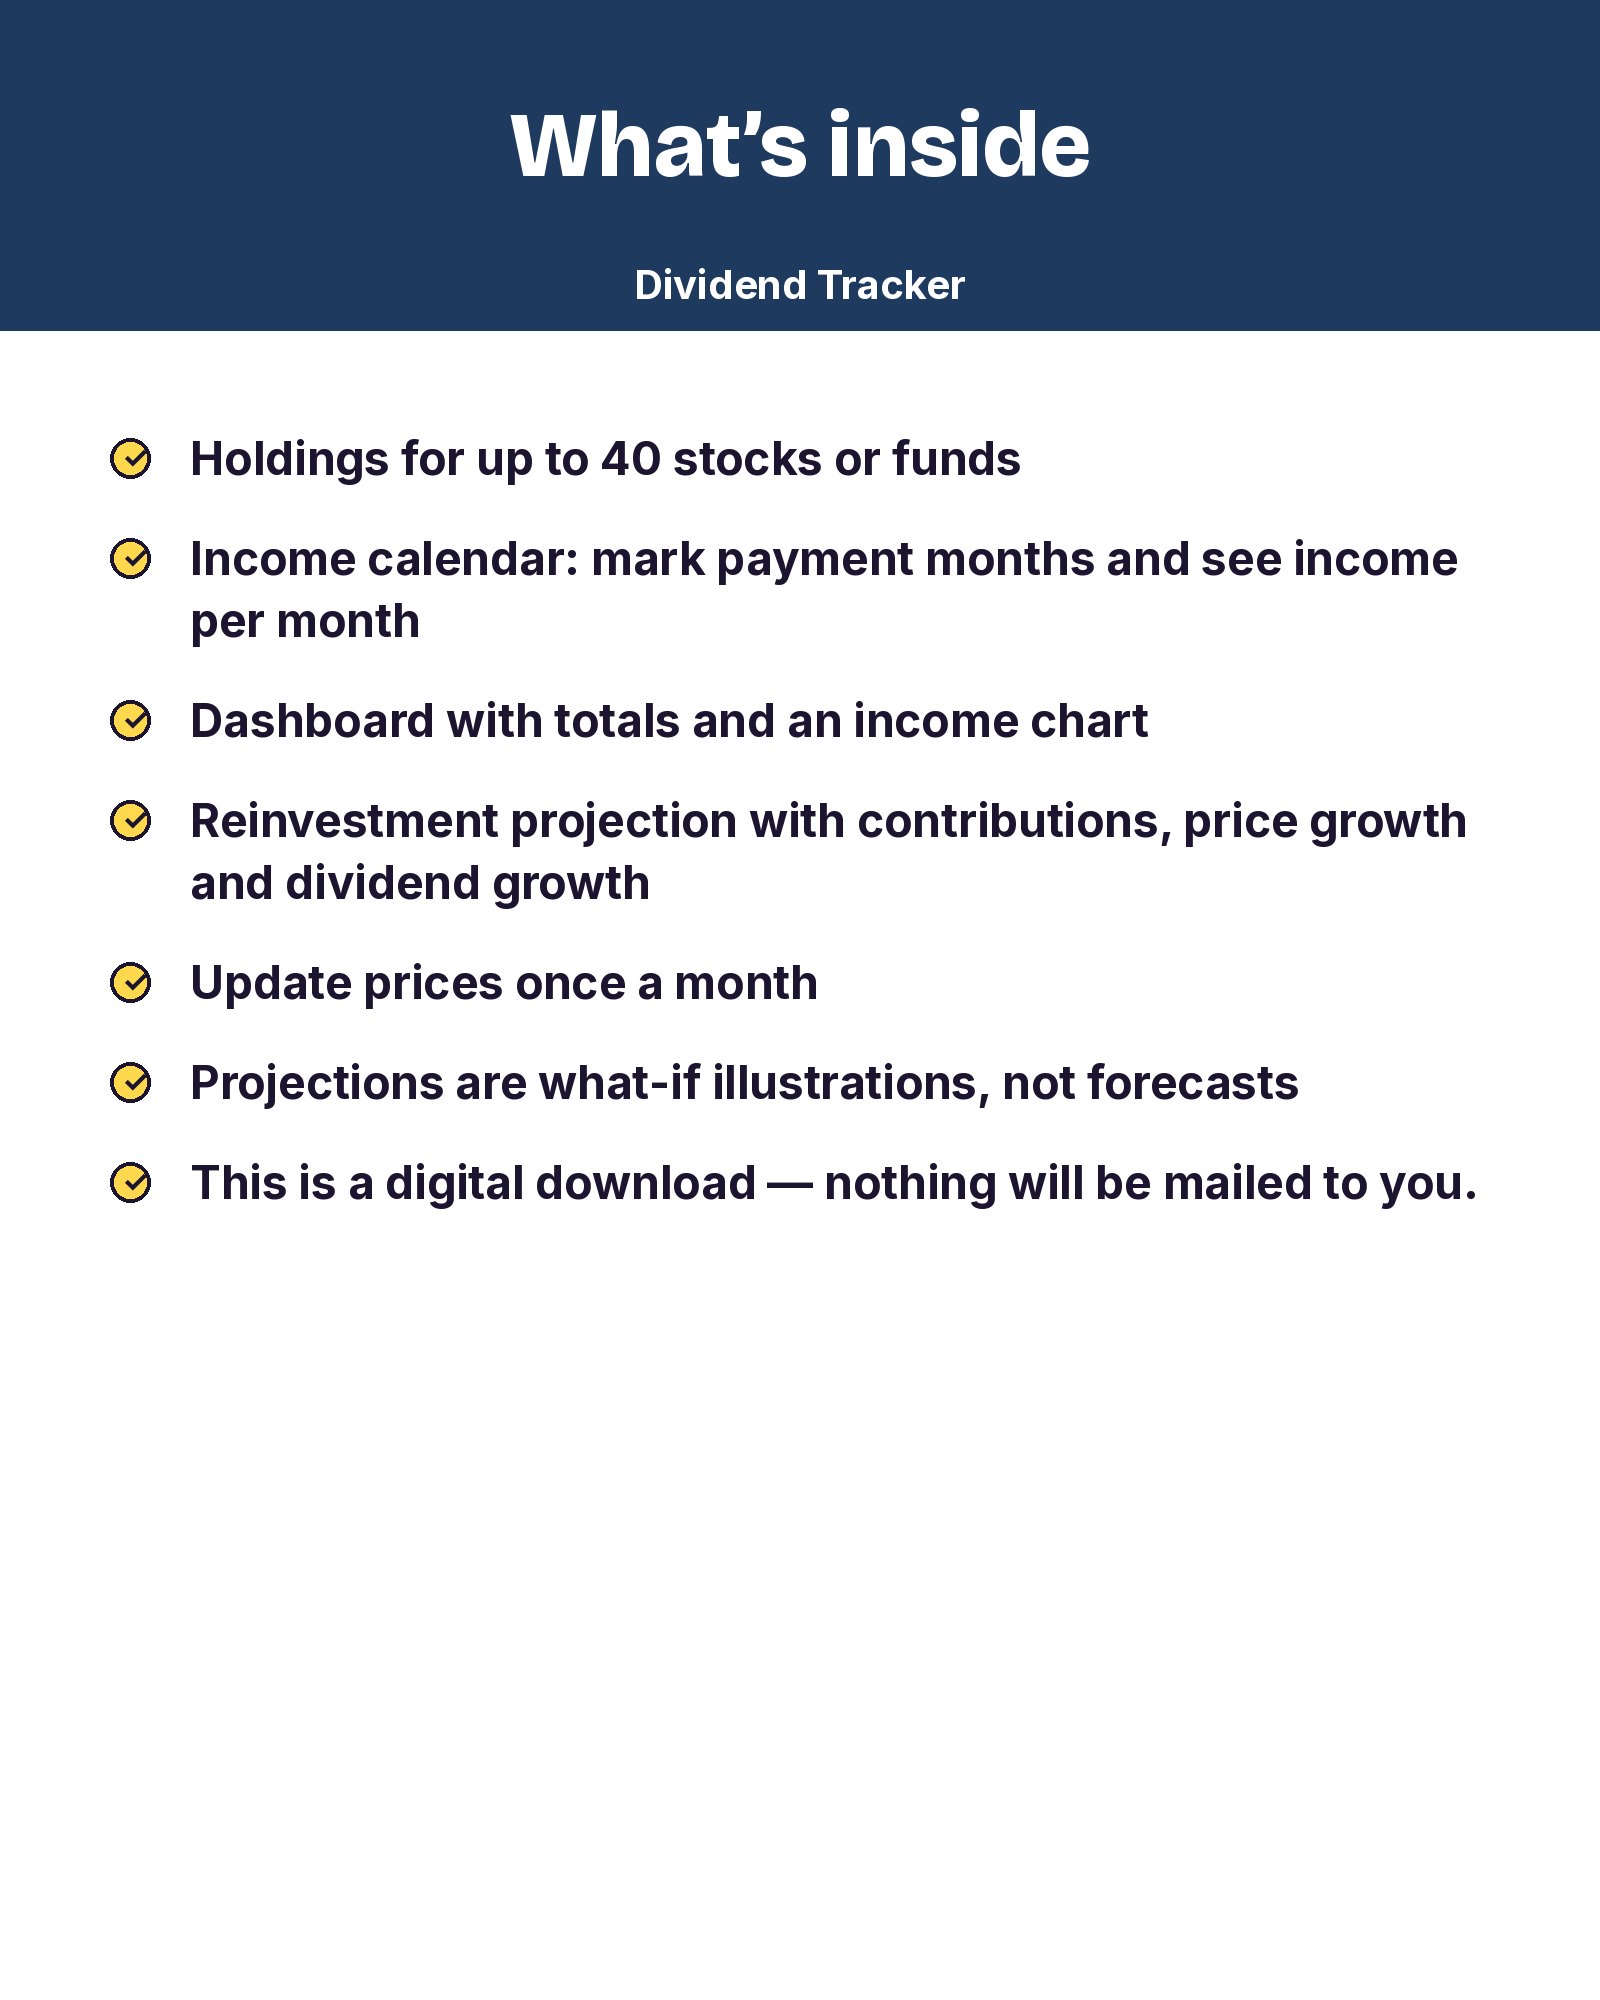
- Holdings for up to 40 stocks or funds
- Income calendar: mark payment months and see income per month
- Dashboard with totals and an income chart
- Reinvestment projection with contributions, price growth and dividend growth
How it works
- Update prices once a month
- Projections are what-if illustrations, not forecasts
Good to know
- This is a digital download — nothing will be mailed to you.
- Works in Microsoft Excel and Google Sheets (free). Instructions for importing into Google Sheets are on the Start Here tab.
- Educational and record-keeping tool — not financial, investment or tax advice. Sample rows use made-up tickers.



Reviews
There are no reviews yet.